Data Burial Experts and Their Tricks
With the burials of many more Australians post The Introduction of SARS-CoV-2 spike protein created from Genetic code in mRNA and adenovector DNA "vaccines" how will the Experts Try to Cover it Up ?
Last Updated 30-Oct-2023
As the World Economic Forum and Eugenicists (in favor of reducing the world population by billions) feared, in the years leading up to Covid-19 “vaccinations”, Australia’s population was living longer and growing steadily.
With the introduction, in Australia, of SARS-CoV-2 spike protein created from Genetic code in mRNA and adenovector DNA "vaccines" there has been a corresponding Boomerang of Death rates across the Population Base.
The vast Majority of SARS-CoV-2 spike protein that entered into the bodies of the Australian population came from Genetic code in mRNA and adenovector DNA "vaccines" as can be plainly seen by the timeline of Injections to cases (and sadly deaths involving this Biologically Developed protein through “Gain of Function Research”.
EXTRA DEATHS
How Can They Be Buried ?…..
Enter the DATA BURIAL EXPERTS
Let’s Exhume Some Data
The scale of date including record reporting per dose of Adverse Events including Death and now the NET extra deaths post roll out of “vaccines” needs to be buried for the heavily invested Vaccine Stake Holders and the Globalists behind the venture.
This has the Data Burial Experts working with and for the “Vaccine” Stakeholders doing all they can to Muddy the waters. Tactics include obscuring the raw data with hyper complex calculations , modelling, cherry picking data, defining statistical terms that sound legitimate and even trying to have us look at unrelated data.
RAW DATA OF DEATHS WHEN ALLOWED TO SURFACE PROPERLY TELLS THE STORY.
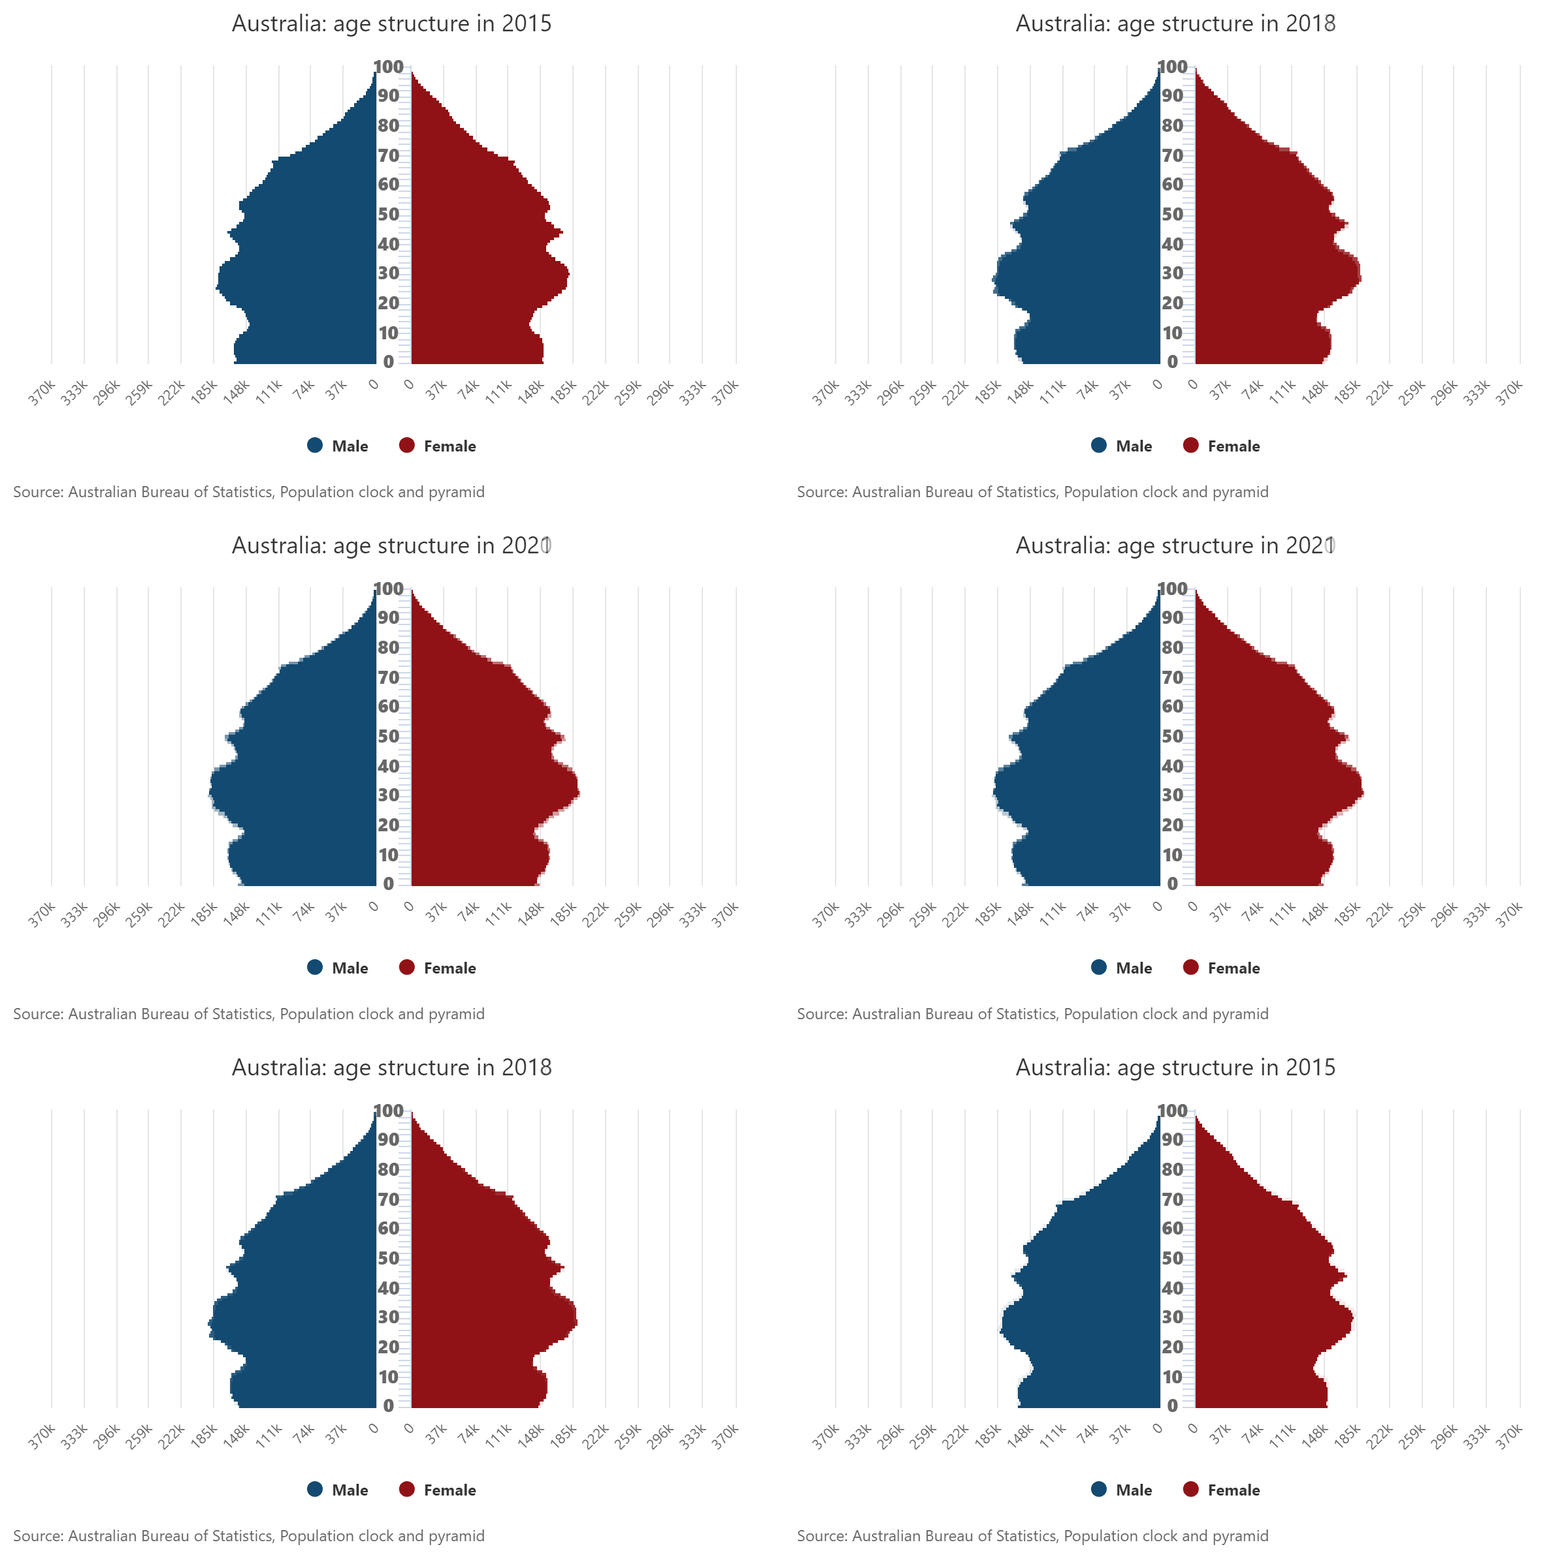
The moving image below covers Eight (8) Consecutive Years of Australian Population Demographics. Can you see a sudden and abrupt change in the trajectory of the Australian population demographics in 2021 or 2022 that might explain the change in mortality rates ? ;obvious answer is no.
With Deaths Data in Australia, we have something better than an “80-20 rule” when looking at where most of the Australian Deaths occur; the majority of Deaths take place (as expected) in the older age groups with between 81% to 84% of the deaths occurring in the 65 and Over age group(s).
A look at some tricks of the trade
A very devious Data Burial Trick (DBT) to cover up the Sudden Increased in Mortality rates starting in 2021 is to use a mean historical mortality rate from “Medieval*” times (times where lower life expectancy was known) and conclude ; “mortality rates historically have been higher”.
An examination of some cover up graph examples:
Things you will see in the red-only graphs below:
A) Data for 2020 is missing (sweeping away the base point for the introduction of “vaccines”)
B) Under 65 Death rates are broken into two groups to give the impression this group represents ⅖ or 40% of all deaths to be considered - We know they represent between 13 to 21%
C) The Yearly changes in Mortality Rates leading up to the “Vaccines” are literally buried (Covered-Up) with one year missing altogether.
Note we know Australian Life Expectancy was increasing steadily every year and so too was the population - the yearly increasing life expectancy has an obvious conclusion; we should see a decreasing mortality rate ;covering up this pattern is essential for the Data Burial Expert
D) While not obvious at first glance the charts are showing Death Rates (not Deaths) This allows for the manipulation of the charts by using false or misleading population bases. To calculate a deaths rate you divide the Raw Data Deaths by the Population in that group (If you mess around with the “Population” even a little and you can produce very different results).
Time to Debunk the above Tricks of the Trade Using Real Unmanipulated Data
Raw Data Sources - ONLY Australian Bureau of Statistic (ABS)
Deaths:
Calendar Years 2015,2016,2017,2018,2019,2020,2021,2022
This data was collated on https://mortality.org/Data/STMF
Link to : The Specific Data File Used
Link to : ABS Data used
Population:
Calendar Years 2015,2016,2017,2018,2019,2020,2021,2022
Link to: ABS Data used
Below we see the Data Burial Trick (DBT) to cover up the Sudden Increased in Mortality rates starting in 2021 using a mean historical mortality rate works well for the Over 65 age group:
*The Graphs Below use a Phrase :
“Medieval” Mortality Comparison Trick
This refers to how easy it is to use Historical Death rates which are known to be Higher. To compare the death rates in Medieval times to Modern times is a ludicrous assumption. It is also ludicrous (and Dangerous) to bury the known Data that clearly shows the life expectancies leading up to the injection of SARS-CoV-2 spike protein into the Majority of Australians was INCREASING and the Death Rates were DECREASING
Now lets add the 2020 Data
Mean historical mortality rate Data Burial Trick (DBT) still works but not quite as well.
Time to rip the band aid off the Extra Deaths In Australia Data Burial.
By getting us to look at ONLY the averages of Data (in the years proceeding the vast majority of SARS-CoV-2 spike protein that entered into the bodies of the Australian population from Genetic code in mRNA and adenovector DNA "vaccines") it covers up the historical movement from one year to the next of the rates of Death prior to “Vaccines”.
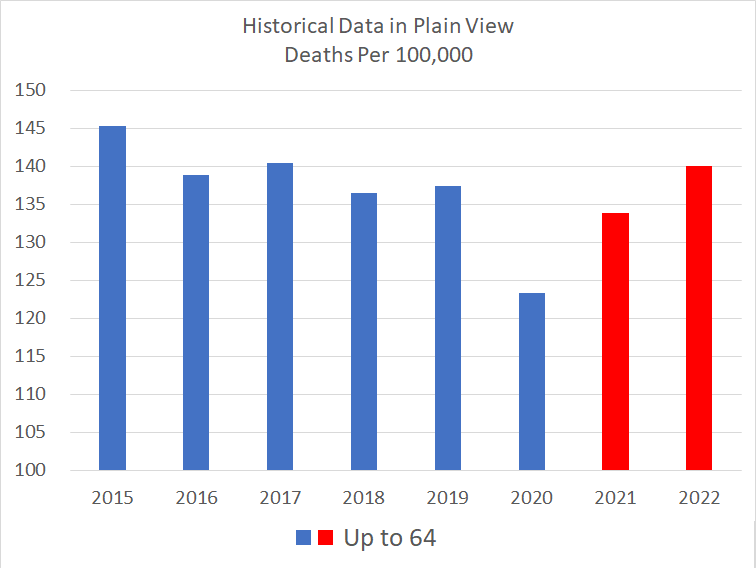
Below, the movements of Death Rates are charted and quantified.
What your eyes are NOW showing (above) is the DEATH Data for each year leading up to and then after the introduction of a body wide Bio distribution involving massive numbers of Lipid Nano Particles (LNP) each containing SYNTHETIC mRNA which in turn carry Genetic instructions that “hijack” the resources of the cells they penetrate and manipulate for the production of SARS-CoV-2.
Can you guess which year the Majority of Australians were mandated to and received these “instructions” ?
(Spoiler ; Yes it was 2021)
BEFORE “VACCINES”
For the Six (6) Years BEFORE the Introduction of SARS-CoV-2 spike protein created from Genetic code in mRNA and adenovector DNA "vaccines"
The largest annual increase in crude mortality was 15 Deaths per 100,000 with an average annual DECREASE of 7 Deaths per 100,000 of this Period
AFTER “VACCINES”
For the Six (2) Years AFTER the Introduction of SARS-CoV-2 spike protein created from Genetic code in mRNA and adenovector DNA "vaccines"
The largest annual increase in crude mortality was 59 Deaths per 100,000 with an average annual INCREASE of 46 Deaths per 100,000 of this Period
Or as a simple Line Graph:
Remember what the Data Burial Expert will want to do is to cover up the patterns that are very clear if you know where to look.
Above we look at just 6 years prior to the Introduction of SARS-CoV-2 spike protein created from Genetic code in mRNA and adenovector DNA "vaccines"
But the turn around is much more than a boomerang; its a Ski Jump; mortality rates have been falling for close to 40 years until….
Above ski slope is one of Standardized Death Rates:
You can view the graph plot on the ABS Website here : Link
You can see the very bottom of the ski slope matches well with the 8 years of mortality rates we have calculated from the raw data..
The following table shows what was discussed above and also it dismantles a more complex Data Burial Expert Trick.
That trick being to assert that the upward swing in death rates after “vaccinations” are due to expected increases in Mortality with a growing top heavy (older) population.
The Data Burial Expert will assert that if you simply apply the death rates from one year to the following year with a different population balance you increase the Mortality rate mathematically (“Nothing to do with storms, wars, diseases or vaccine drives”).
So in the table we do Just that for every year from 2015 to 2022.
Below are two excel sheets compiling the above charts (Not the RED CHARTS) using only data from the Australian Bureau of Statistic (ABS)
Data Analysts everywhere are invited to scrutinize the files and working and provide comment and perhaps to take it further with other GENUINE country data.
Or Share via Text: https://tribeqr.com/v/databurial01
Or Share via Text: https://x.com/tniwef/status/1718429493667275148
Disclaimer: All content is presented for educational and/or entertainment purposes only. Under no circumstances should it be mistaken for professional advice, nor is it at all intended to be taken as such. The contents simply reflect current newsworthy items on Covid that are freely available. It is subject to error and change without notice. The presence of a link to a website does not indicate approval or endorsement of that web site or any services, products, or opinions that may be offered by them.
Neither this Substack nor any of its principals or contributors are under any obligation to update or keep current the information contained herein.
Although the information contained is derived from sources which are believed to be reliable, they cannot be guaranteed.
Disclosure: We accept no advertising or compensation, and have no material connection to any products, brands, topics or companies mentioned anywhere on this post.
Fair Use Notice: This post may contain copyrighted material the use of which has not always been specifically authorized by the copyright owner. This post is making such material available in efforts to advance understanding of issues of social significance. We believe this constitutes a ‘fair use’ of any such copyrighted material as provided for in section 107 of the US Copyright Law. In accordance with Title 17 U.S.C. Section 107, the material on this site is distributed without profit. If you wish to use copyrighted material from this site for purposes of your own that go beyond ‘fair use’, you must obtain permission from the copyright owner.


There’s another way to hide data. I suffered a vaccine injury late Sept 21- I went to the TGA website and at that time, anyone over 65 with vaccine injury/ death were considered it was age related. I had a good source at the time who told me that patients with d- dimer results ranging from 500-10,000 who suffered major injury were told it was because of their age, despite no pre-existing conditions. They tried to hide deaths from vaccines, by saying the elderly were dying because they were vulnerable. Nursing homes were most guilt of highly vaccinated group- still are.
They totally believe long COVID BS . Long COVID clinics are a nonsense. There’s a lab in QLD researching treatment for long COVID. And now Pfizer shares have plummeted they are moving to research and drug development of clots myocarditis etc- cause the problem find the solution. Keep fleecing you victims , great business model